When you debug a script, you control the execution of statements. The debugger stops at breakpoints and writes trace statements at tracepoints.
To start the debugger
•Click Home > in the Debug section, click Go (F5):
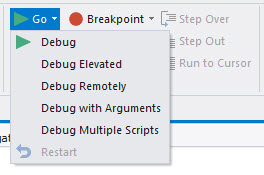
To debug a script in elevated mode
•Click Home > in the Debug section, click the Go menu > then click Debug elevated.
The script runs and writes output to the Output pane until it reaches a breakpoint. When it stops at a breakpoint, a yellow arrow in the margin indicates the line of code executes next:
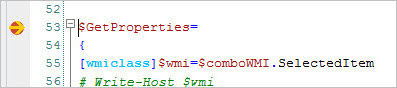
 When the script is stopped at a breakpoint, you can add or remove breakpoints, but you cannot edit the script.
To execute the next line of code (step into)
•Press F11.
The yellow arrow advances to the next line of code.
To stop the debugger
•Click Home > in the Debug section, click Stop (Shift+F5).
See also: